Indicator Architecture
The architecture covers the five thematic areas of diets, nutrition, and health; environment, production, and natural resources; livelihoods, poverty, and equity; governance; and resilience. Each thematic area is described by several different domains, under which there are specific indicators identified to be tracked.
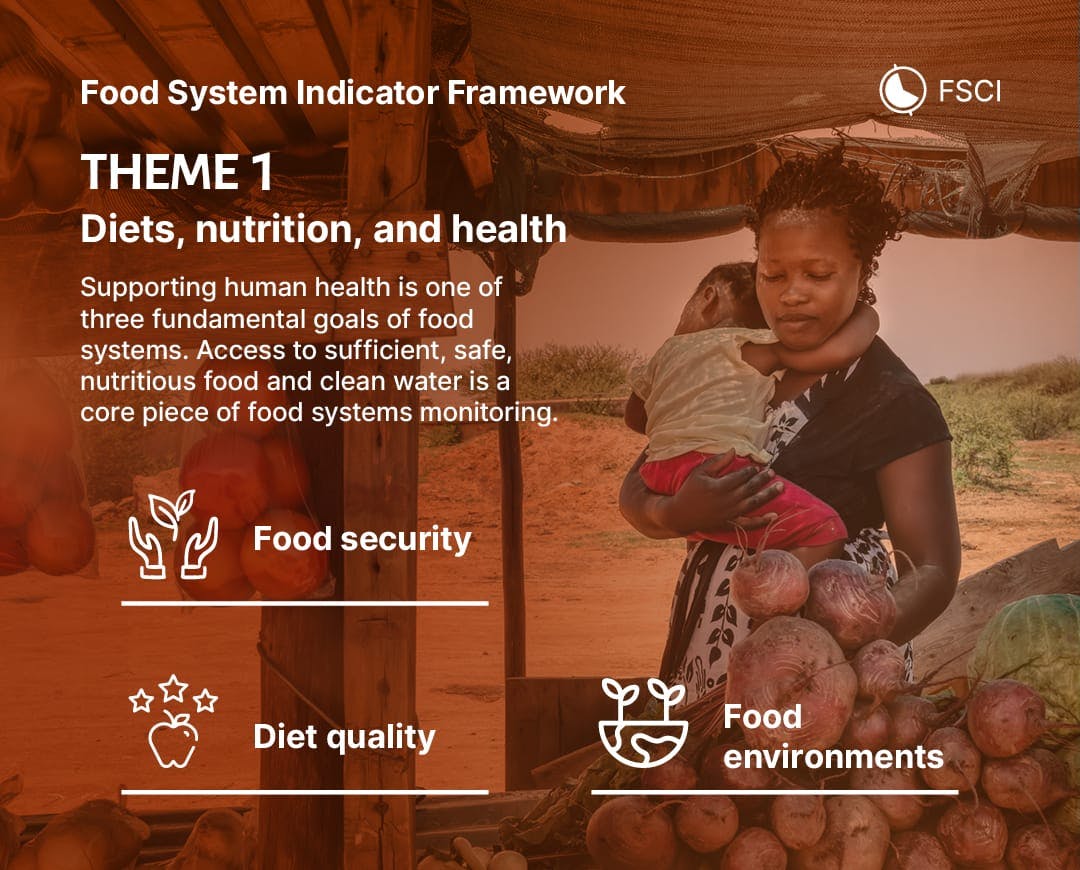
Thematic Area 1: Diets, nutrition, and health
Food environments
Food environments encompass availability, affordability, and properties of food (including safety, quality, convenience, and sustainability), as well as food messaging and vendor properties.
Indicators
Cost of a healthy diet
Per-person cost of the least expensive locally available foods to meet daily needs, based on food-based dietary guidelines.
Source: FAOSTAT
Availability of fruits and vegetables
Amounts of fruits and vegetables—an underconsumed yet highly nutritious food group—available in a country's food supply per capita per day.
Source: FAOSTAT
Retail value (total sales) of ultra-processed foods
Annual per- person sales of ultra-processed foods, which are known to be associated with poor health outcomes.
Source: Euromonitor International: Packaged Food, 2025 Industry Edition and Euromonitor International: Soft Drinks, 2025 Industry Edition © All rights reserved, population from World Bank
Percent population using safely managed drinking water services (SDG 6.1.1)
Share of the population that gets drinking water from an improved source, providing the clean water essential for food security (SDG 6.1.1).
Food security
Food security exists when “all people at all times have physical, economic, and social access to sufficient, safe, and nutritious food that meets their dietary needs and food preferences for an active and healthy life.”
Indicators
Prevalence of Undernourishment (SDG 2.1.1)
Share of the population that goes hungry—that is, lacks enough calories for a healthy, active life (SDG 2.1.1).
Source: FAOSTAT
Percent population experiencing moderate or severe food insecurity (SDG 2.1.2).
Share of the population experiencing food insecurity, measured according to the Food Insecurity Experience Scale (FIES) (SDG 2.1.2).
Source: FAOSTAT
Percent population who cannot afford a healthy diet
Share of the population whose food budget is less than the cost of a healthy diet.
Source: FAOSTAT
Diet quality
A healthy diet is “health-promoting and disease-preventing. It provides adequacy without excess of nutrients and health-promoting substances from nutritious foods and avoids the consumption of health-harming substances.” Diet quality is measured at the individual level to characterize individual dietary consumption.
Indicators
MDD-W: Minimum dietary diversity for women
Share of women who consumed at least the minimum recommended food groups the previous day, which makes it more likely they consume adequate micronutrients.
MDD (IYCF): Minimum dietary diversity for infants and young children diversity
Share of young children who consumed at least the minimum recommended food groups the previous day, which makes it more likely they consume adequate micronutrients.
Source: UNICEF
All-5: Consumption of all 5 food groups
Share of the adult population consuming all five food groups typically recommended for daily consumption.
Zero fruit or vegetable consumption
Share of the population (adults or young children) who did not consume any fruits or vegetables the previous day.
Source: Global Diet Quality Project / Gallup World Poll, UNICEF
NCD-Protect
Average score for adults on an indicator of dietary practices protective against noncommunicable diseases, like eating enough fiber, on a scale from 0 to 9.
NCD-Risk
Average score for adults on an indicator of dietary practices known to raise the risk of noncommunicable diseases, like eating too much sugar, on a scale from 0 to 9.
Soft drink consumption
Share of adults who consumed a sugar-sweetened soft drink, which are generally known to be unhealthy, during the previous day.
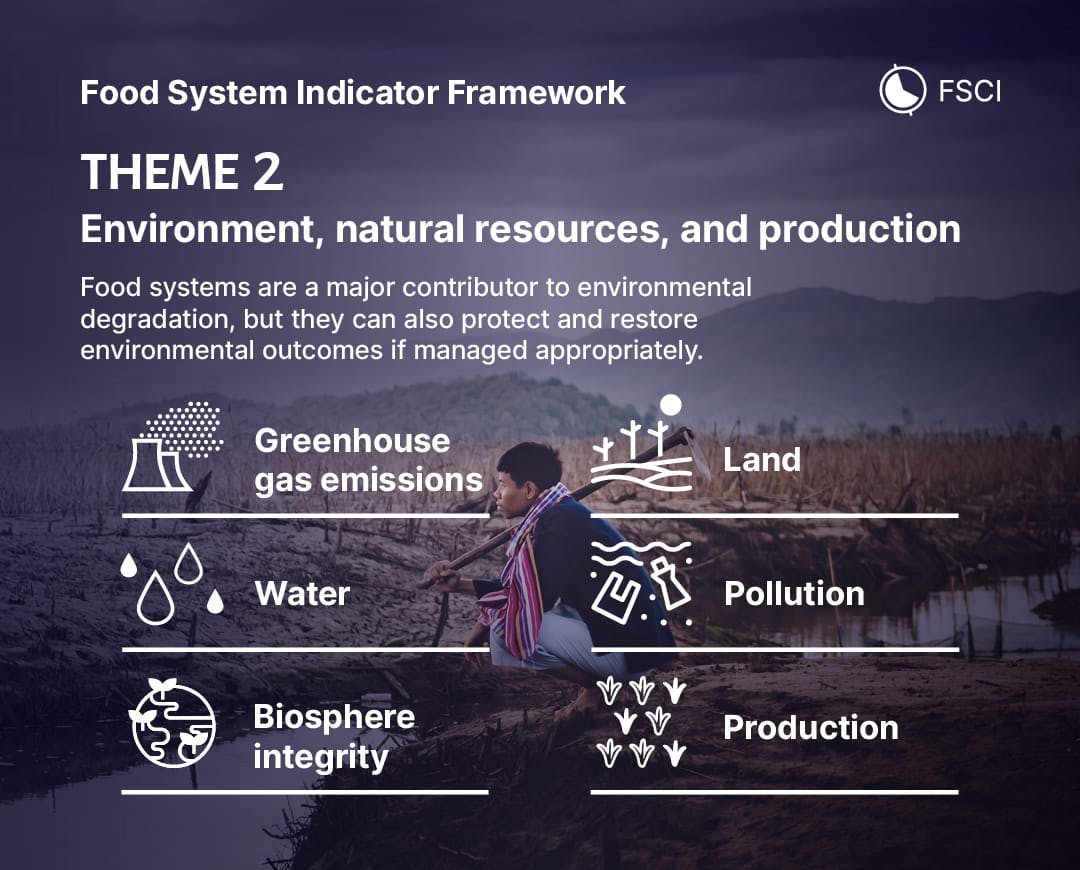
Thematic Area 2: Environment, natural resources, and production
Greenhouse gas emissions
Food systems account for 21-37% of total GHG emissions, two-thirds of which come from crop and livestock production, land use, and land use change, and the remainder from processing, transport, and packaging. Specific emissions of concern relevant to food systems are methane from enteric fermentation (in ruminant animals) and rice paddies; carbon dioxide from land use change, transport, and processing; and nitrous oxide from fertilizer application and manures.
Indicators
Production
Agricultural productivity measures agricultural outputs per a given quantity of inputs - in other words, it measures the efficiency with which inputs are used to produce agricultural output. The expansion of farmland and the intensification of resource use needed to meet the growing global population's food demand places a heavy burden on natural ecosystems. Raising the productivity of existing natural resources is thereby considered a critical path to meet food and nutrition security needs of current and future generations.
Indicators
Yield, by food group
Yield, or production per unit area (tonnes per hectare) or per animal (kg per animal)—an indicator of how efficient production is.
Source: FAOSTAT
Land
Agriculture dominates global land use with approximately 1.5 billion hectares of cropland, of which 30-40% is used to produce feed, and 3.5 billion hectares of grazing land. Together, these lands cover approximately 40% of the world's ice-free land. Tracking land use change is essential, as it is at the center of many environmental processes. Halting deforestation and land conversion will reduce GHG emissions, improve water cycles, and protect biodiversity; together with restoration, this action has the potential to store 200-330 gigatons of carbon. The concept analogous to land use for aquatic systems is the spatial expanse of inland waters and oceans used for aquatic capture food production.
Indicators
Cropland area change
Average percentage change in cropland over the previous five years; expanding cropland is a major driver of biodiversity and ecosystem service loss and greenhouse gas emissions.
Source: FSCI
Water
Water scarcity constrains food systems and human well-being; an estimated 1.2 billion people experience physical water scarcity and another 1.6 billion have insufficiently developed water resources. Food production is responsible for 70-80% of global freshwater “consumptive use”—surface and groundwater removed from the local water cycle—which can drive water scarcity if not locally replenished.
Indicators
Agriculture water withdrawal as percent of total renewable water resources
Water withdrawn for irrigation each year, as a percentage of the total renewable water resources available.
Source: AQUASTAT
Biosphere integrity
Biosphere integrity is a measure of the quantity and quality of natural systems and resources required to maintain nature's contributions to people and halt species extinction. Within food production systems, it is nature's capacity to support food production.
Indicators
Functional integrity: Percent agricultural land with minimum level of natural habitat
Percentage of agricultural land area with enough semi-natural or natural habitat, relative to the amount of cropland or rangeland, to maintain biodiversity and functioning ecosystems.
Source: DeClerck et al. 2021
Fishery health index progress score
An indicator summarizing the availability and sustainability of fish, which are at risk of overfishing or environmental degradation.
Source: Minderoo Foundation
Pollution
Environmental pollution from food systems can be classified into four major categories: (1) nutrient loss and run-off (e.g., nitrogen, phosphorus) from food production into water bodies, land, and/or air, and soil degradation; (2) novel entities, notably biocides (e.g., pesticides, antibiotics) used in agricultural production systems; (3) particulate air pollution from food systems (e.g., burning residues or land clearing, air pollution caused, to a large degree, from manure and nitrogen fertilizer application); and (4) solid waste across food value chains (e.g., non-degradable plastics, other non-degradable unrecycled materials, excess animal waste not used as fertilizer, food waste of which 95% is estimated to be sent to landfills).
Indicators
Pesticide use per area of cropland
The use of pesticides per area of cropland (kg active ingredient per hectare); pesticide use can cause pollution and harm health.
Source: FAOSTAT
Cropland nitrogen use efficiency
A measure of the efficiency of nitrogen application in agricultural production.
Source: FAOSTAT
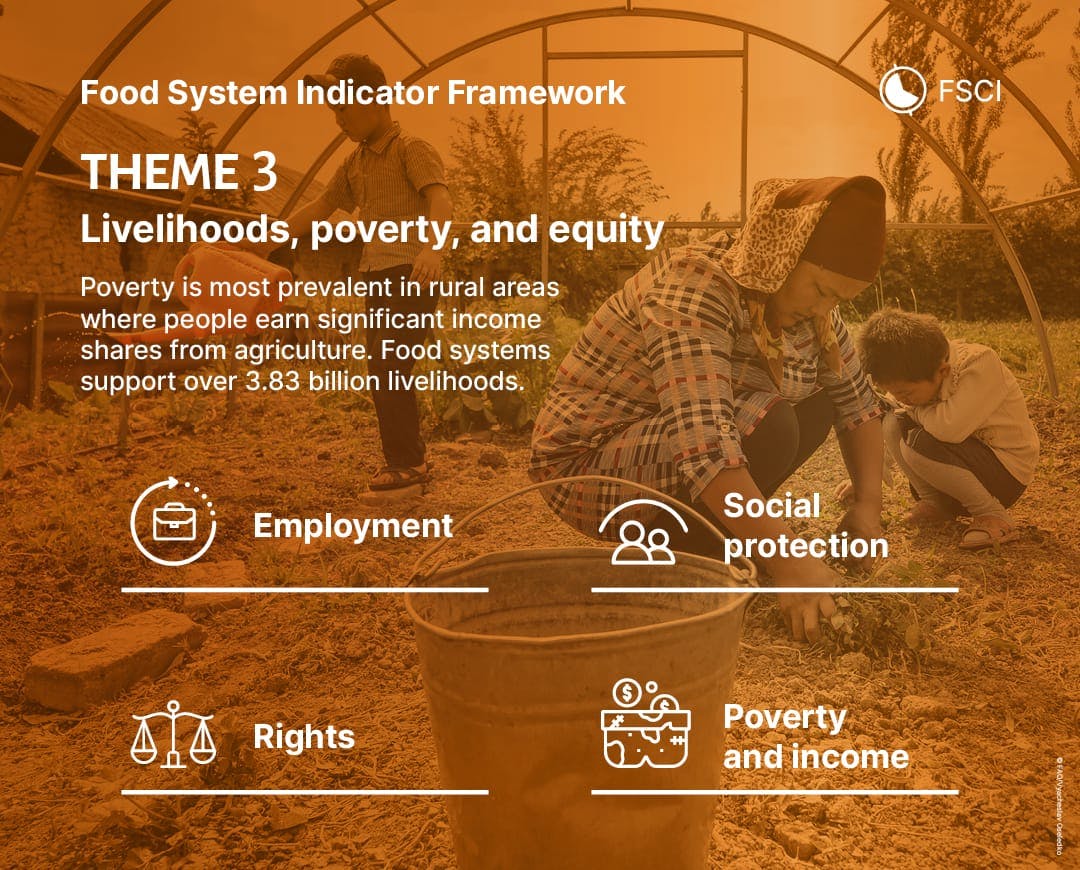
Thematic Area 3: Livelihoods, poverty, and equity
Poverty and income
Agriculture employs a disproportionate share of the world's poorest people, and poverty affects workers throughout food systems, across the rural-urban divide, and at all country income levels. Wages in food systems are commonly below minimums established for other sectors, particularly for migrants, women, and other minoritized groups.
Indicators
Share of agriculture in GDP
Percentage of a country's GDP derived from agriculture, a measure of the level of economic development of the country.
Source: FAOSTAT
Employment
Tracking employment quantity and quality is essential to improving equity and livelihoods in food systems. Existing data can capture the scale of primary employment in agriculture, food manufacturing, and food and food-related hospitality services. Coverage is uneven in other food-based jobs, such as trade and transportation, or where it is difficult to capture the contributions of family labor, seasonal fluctuations, and secondary employment.
Social protection
Universal social protection, i.e., guaranteed minimum access to healthcare, pensions, income or food by vulnerable or low-income citizens regardless of their employment status, is particularly important to support the livelihoods of many food system workers due to the widespread vulnerability and poverty described above. Further, many social protection programs are tied to food, and therefore may play multiple roles in food system transformation.
Indicators
Social protection coverage
Percentage of people who live in households that benefit from social protection programs, like cash transfers and health insurance.
Source: World Bank
Social protection adequacy
An indicator showing the extent to which social protection is sufficient to meet household needs.
Source: World Bank
Rights
Ensuring the human rights of all is key to transforming food systems from their current state to one that is equitable. The most basic right in food systems is the right to food, codified in the Universal Declaration of Human Rights; the International Covenant on Economic, Social and Cultural Rights; and the UN Declaration on the Rights of Peasants and Other People Working in Rural Areas. The rights to water and participation in public affairs have also been codified by the UN. Specific rights that affect the livelihoods of food system workers include land and property rights, especially for women; rights to unionization and collective action; and rights to public space, which are crucial for informal workers.
Indicators
Percent children 5-17 engaged in child labor
Percentage of children ages 5-17 who are engaged in child labor, the majority of which is known to be in the food system and specifically in agriculture.
Source: UNICEF
Share of women among owners or rights-bearers of agricultural land (SDG 5.a.1)
Percentage of owners or rights-bearers of agricultural land who are female.
Source: SDG Indicators Data Portal
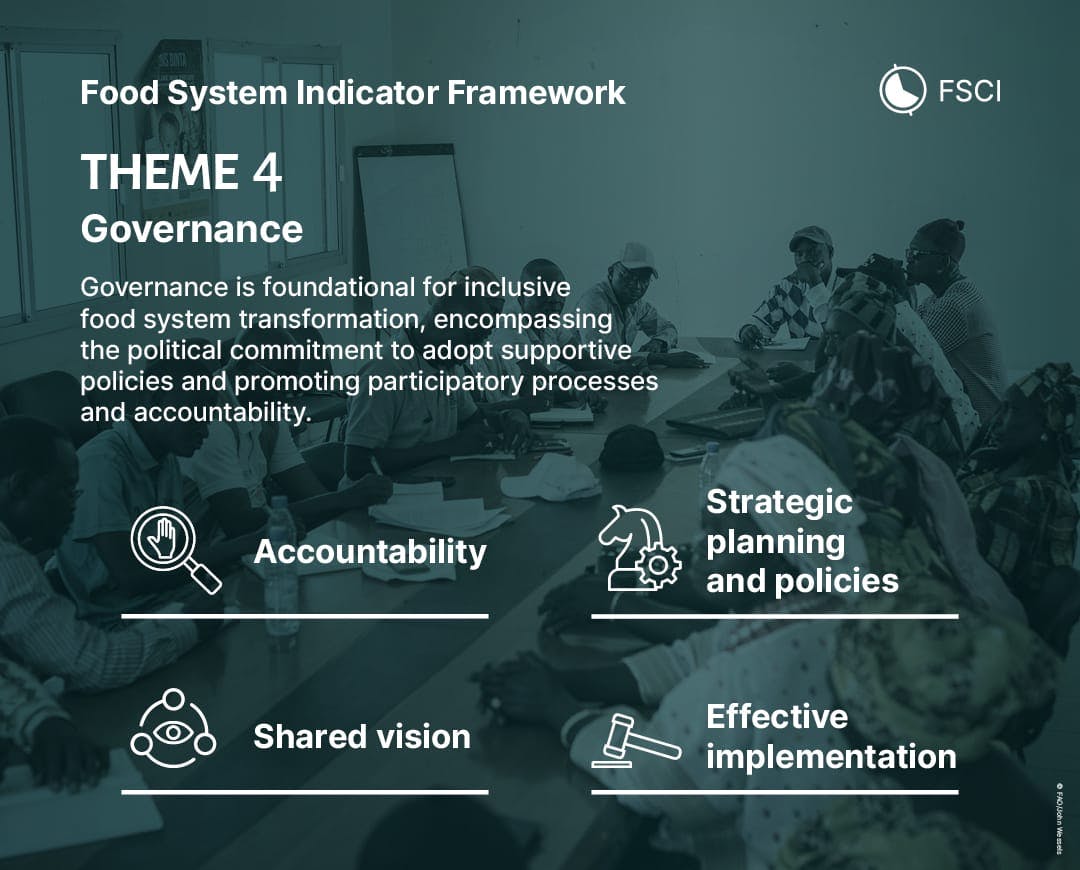
Thematic Area 4: Governance
Shared Vision and Strategic Planning
Shared vision refers to inclusive, participatory processes to identify priorities and provide guidance on desired outcomes across all the thematic areas of food system transformation. It can be measured by, for example, whether governments establish multi-stakeholder platforms incorporating relevant stakeholders at regular intervals. Where they have been used, such platforms uncover hidden power dynamics and informal relationships that constrain progress. Achieving shared vision also requires redressing power imbalances, which include market competition and asymmetries in influence that different actors hold in negotiations. A growing body of literature measures the level of concentration and market power in global food value chains, highlighting how such concentration of power in the hands of a few corporations has a wide range of negative consequences for food systems. Strategic planning and policies must underpin the shared vision, including relevant legal frameworks and multi-sectoral policy documents that holistically address food systems and reconcile trade-offs. The general degree of public sector policy coordination is indicative of the potential to develop well-aligned food system policies.
Indicators
Civil society participation index
An indicator capturing the level of participation in civil society organizations.
Source: Varieties of Democracy
Percent urban population living in cities signed onto the Milan Urban Food Policy Pact
Percentage of the urban population that lives in cities signed on to the Milan Urban Food Policy Pact, suggesting prioritization of food issues in urban planning.
Source: Milan Urban Food Policy Pact, Oakridge National Laboratory (Landscan population product), FSCI
Degree of legal recognition of the right to food
An indicator that classifies countries by the extent to which national laws or policies recognize or enact people's right to sufficient food.
Presence of a national food system transformation pathway
Whether the country has developed a food system transformation pathway through the UNFSS process.
Effective implementation
Effective implementation requires the alignment of strategic planning and policies with state, private sector, and civil society capacities that are supported by sufficient human and financial resources. Governments must allocate relevant human resources—including agricultural extension agents, food safety and quality regulators, cadastral agents, and health providers—to ensure policy actions can be realized. And in more decentralized countries, where autonomy and authority for functions critical to food systems have been devolved to subnational actors, multilevel coordinating bodies are necessary for effective implementation.
Indicators
Government effectiveness index
An index capturing the perception of how effective the government is in making and enforcing policies and providing services.
Source: World Governance Indicators
Food safety capacity
Whether functioning mechanisms exist to detect and respond to foodborne disease issues, measured as the percentage of a set of criteria met.
Source: WHO Global Health Observatory
Presence of health-related food environment policies
Whether the country has any health-related food environment policies, which are used to discourage consumption of unhealthy foods and beverages or encourage the consumption of healthy foods and beverages.
Accountability
Accountability mechanisms use tracking and evaluation to learn what policies work or not, and reward (or sanction) public and private sector actors who deliver on commitments (or fail to). Food system transformation requires so many actors to work coherently toward the shared vision that collective action problems—when all stand to benefit from coordinating for a collective outcome but individual incentives favor acting in one's self-interest—can emerge, making accountability particularly necessary.
Indicators
V-Dem accountability index
An index capturing the extent to which the government is seen as being accountable for its actions.
Source: Varieties of Democracy
Open budget index score
A score based on how easily the public can access information about how the government raises and spends money.
Source: International Budget Partnership
Guarantees for public access to information (SDG 16.10.2)
Whether the country has and implements guarantees for access to information (SDG 16.10.2).
Source: Sustainable Development Goals
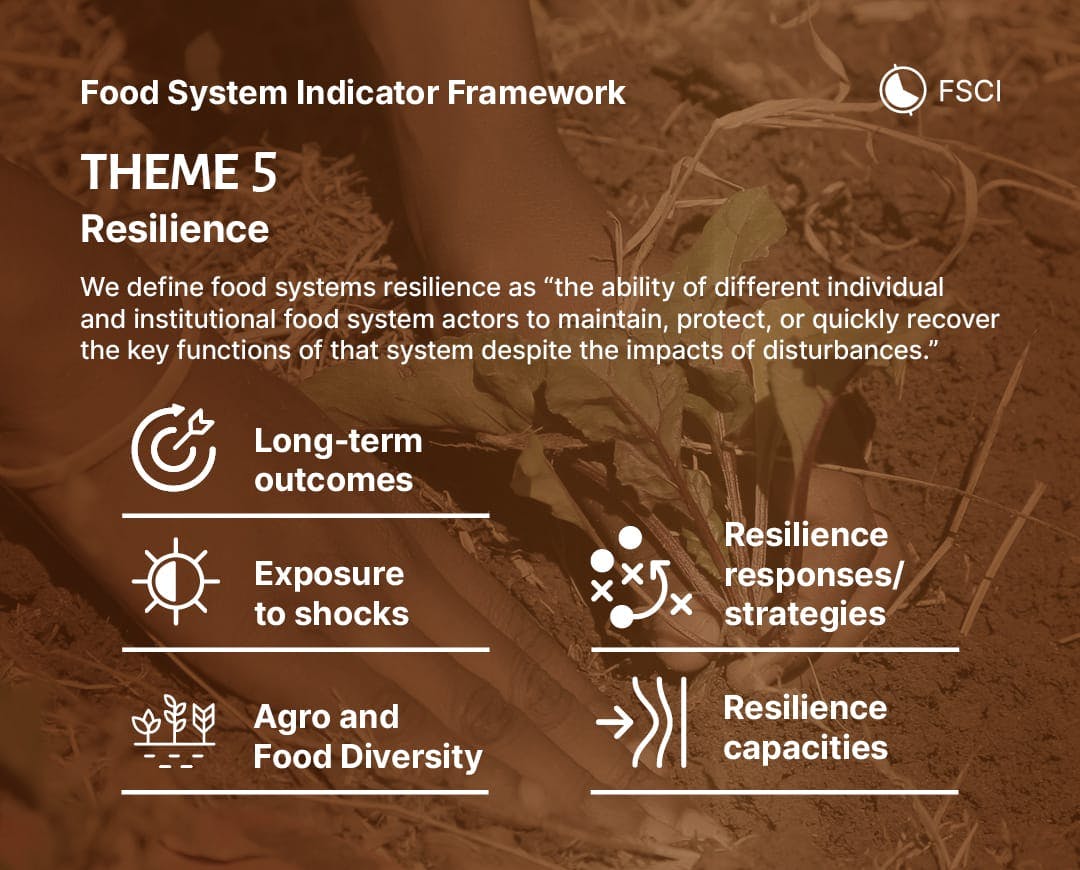
Thematic Area 5: Resilience
Exposure to Shocks
Assessing food system resilience requires first assessing and documenting the adverse events that can affect those systems. Some events have been mentioned previously: droughts and flooding, but also typhoons/cyclones or natural disasters (e.g., earthquakes). Others include local or regional economic crises, political unrest (war in Ukraine or Myanmar), pandemics (e.g., avian influenza, COVID-19), pest outbreaks (e.g., desert locust, fall armyworm), and protracted crises (including population displacements and migrations). Internationally available country-level data (e.g., International Disaster Database, Global Disaster Information System) capture the nature, frequency, and intensity of the main shocks that affect food systems, thus providing one indicator relevant for food system resilience.
Indicators
Ratio of total damages of all disasters to GDP
Cost of all damage from natural disasters, as a percentage of GDP.
Source: EM-DAT
Resilience Capacities
Resilience capacities are the different elements that can be used to buffer and respond to adverse events. Those capacities take many forms. In food systems, the diversity and redundancy of food sources, national infrastructure (proxied by mobile phone coverage) and social capital are some of the key elements that constitute resilience capacities.
Indicators
Dietary sourcing flexibility index
An index capturing the diversity of pathways through which food reaches consumers, indicating how difficult it is to disrupt the food supply.
Source: FAO
Mobile cellular subscriptions
Number of mobile phone subscriptions as a percentage of the population, indicating the level of infrastructure and access to information to respond to shocks.
Social capital index
An index for the social capital in the country—how much people feel they can trust and can rely on their government and one another.
Source: Legatum Institute, FSCI
Agro- and Food Diversity
There is a large, well-established body of evidence that agrobiodiversity and food diversity play important roles. Agrobiodiversity in and around cropping systems build resilience in crop, livestock, forest, fishery, and aquaculture. Interactions between genetic, species, and ecosystem diversity at different spatial scales maintain stability in the face of increasing occurrence of shocks and stresses, enable adaptation, and support recovery from disturbances. Moreover, agrobiodiversity secures the resilience capabilities of food systems for future generations and yet-unknown shocks. Food diversity underpins healthy diets with most food based dietary guidelines recommending a diet that is high in food group diversity.
Indicators
Proportion of agricultural land with minimum level of species diversity (crop and pasture)
Percentage of agricultural land (crop and pasture) containing a sufficient diversity of species, which helps cope with shocks and changes.
Source: Jones et al. 2021
Number of (a) plant and (b) animal genetic resources for food and agriculture secured in either medium- or longterm conservation facilities (SDG 2.5.1)
Number of plant and animal genetic resources for food and agriculture secured in medium- or long-term conservation facilities (SDG 2.5.1).
Source: FAOSTAT
Resilience responses/strategies
Not all responses adopted by individuals, communities, or societies to anticipate or mitigate/buffer the impact of shocks and stressors result in positive outcomes, either in the short- or longer-term. For instance, at the household level, it is well documented that certain coping strategies (e.g., distress selling of assets, reduction of expenses or food consumption) can have very detrimental effects on the immediate or long-term wellbeing of households (e.g., nutritional status, food security). These detrimental long-term outcomes can, however, also be observed in the case of adaptive (or even transformative) responses, leading to what is referred to in the climate change literature as “maladaptation” (Barnett and O'Neil 2013). What this implies is that, understanding and measuring resilience also requires documenting and tracking these responses as an attempt to strengthen the ability of households and society to choose what they perceive at that time as the “right” response(s), rather than being forced by circumstances or lack of information to pick options which might be detrimental overall. This approach is also in line with the definition of resilience as proposed by Constas et al (2014): “resilience is the capacity that ensures stressors and shocks do not have long-lasting adverse development consequences”.
Indicators
Prevalence of severe coping strategies
Percentage of high-risk populations who need to rely on extreme strategies to cope with food insecurity.
Source: WFP
Long-term outcomes
In line with the point above, if we accept that the ultimate goal of building resilience is not to achieve resilience per se, but rather to improve (or at least, to maintain and protect) long-term individual and collective wellbeing in the face of shocks and stressors, then the indicators used to measure those long-term outcomes should reflect these improvements in human well-being. In the context of food systems many of those improvements will revolve around food security and nutrition. Tracking the stability of the different pillars of food security (food availability, access, and utilization) could therefore be an important element in measuring food system resilience, but it could include other indicators such as the stability in the livelihoods of these involved in food system activities (e.g. protecting informal street vendors' jobs following the shut-down of open-air/wet markets during the COVID-19 pandemic). The emphasis, however, should be on measuring (in)stability over time rather than absolute values. In that context, the FAO Price volatility index measuring stability of food access and the per capita food supply variability index measuring stability of food supply availability are two other possible indicators of long-term resilience outcomes.
Indicators
Food price volatility
How much food prices varies over time, indicating how well the food system can respond to shocks.
Food supply variability
How much food supply (in calories per person per day) varies over time, indicating how well the food system can respond to shocks.
Source: FAOSTAT